Under the Hood, Part I: How We Track Our Marketing Efforts
The Marketing Department IS responsible for the blog, so of course we’re going to talk about ourselves first!
 This month, we’re going to give you a few glimpses of processes that normally happen ‘behind the scenes’ here at Royal Rose Properties, to show you why we’re proud of the way we do business (but never satisfied). We’re starting out by looking at the relatively complex process that produces our bi-monthly Marketing Reports we send to our property owner clients regarding each property that is currently being advertised.
What We Track…
Every week, we go through our biggest traffic sources and we harvest data on the number of hits each advertisement received that week. Then our management software produces reports that tell us about the number of inquiries, scheduled showings, and applications we received on each property. Finally, our agents report on the number of people who actually showed up for the showings we scheduled. All of that data is put into our customized tracking sheet:
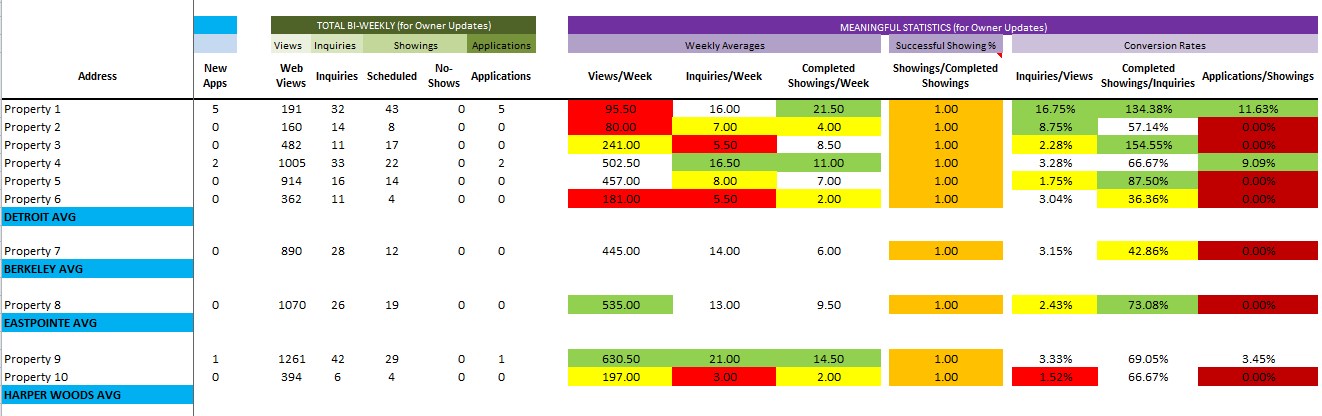
The tracking sheet’s formulas produce several bits of information about the last marketing period for each property, including:
- Views per week
- Inquiries per week
- Showings scheduled per week
- Successful showings per week
- Applications per week
- Conversion ratio of views to inquiries
- Conversion ratio of showings scheduled per Inquiry
- Conversion ratio of successful showings per showing scheduled
- Conversion ratio of applications per successful showing
It also tracks the lifetime total of all 5 steps per ad, and divides that lifetime total by the number of days the ad has been published to get per-day stats for each ad.
Furthermore, each of those categories is automatically colored by an algorithm that alerts us to which ads are in the bottom 20% (red), second 20% (yellow), third 30% (white), and top 30% (green) in each category. This gives us an instant snapshot of what (if anything) needs to be attended to on each ad.
…And Why
Each of these numbers is valuable in its own way.
- The “X per week” numbers give us a good idea of the general levels of interest and tenant quality in an area. If we notice, for example, that all of our ads in a given neighborhood consistently show lower Views per Week than others, we know there’s just no one looking there. This kind of tracking allows us to distinguish quickly between “environmental” effects like a disinteresting neighborhood and “ineffective ad” conditions, which will stand out from its peers in the “X per week” categories.
- The “X per Y” conversion rates, by contrast, tell us about how the home-seekers are regarding the property. For example, if a property gets lots of Views and not many Inquiries, it means there’s something about the property (or the ad) that isn’t visible from the title or main picture, but can be seen within the body of the ad or the secondary photos that is turning house-hunters away. Or if we’re getting plenty of Scheduled Showings and not many Successful Showings, the most likely scenario is that people are scheduling showings and then driving by the house and deciding they don’t like what they see and skipping out on the scheduled showing with our agent.
- The “lifetime” statistics help us establish changes in certain areas. If a given area’s week-over-week numbers start to meaningfully diverge from the lifetime averages of ads in that area, we know that something is going on, either positive or negative, that we may have to work around or take advantage of. Then it’s on us to figure out what it might be and report to our owners.
The Final Stages
Each period we produce a report that gives the owners the data in the most easily-consumable form: Views, Inquiries, Showings Scheduled, Successful Showings, and Applications from that half-month. We could include all of the ratios and other information on our Marketing Reports, but we’re not sure our clients would understand that level of data detail.
We find, however, that it’s more efficient for our owners if we keep the math to a minimum and instead accompany those basic numbers with an analysis of what they mean, with emphasis on what actions, if any, we suggest to improve the marketing situation.
This not only prevents us from overloading our clients with information that will more often distract them from the important issues than not, but it forces us to actively analyze each ad that is underperforming and figure out why so that we can present it to our clients. This, in turn, keeps the Marketing Department as a whole engaged with the ongoing processes of each of the properties we oversee.
Finally, we keep the reports that we produce for three months, so that we can refer back to them and look at previous suggestions we’ve made, how long it’s been since we had an active applicant, and other rare but important questions.
Altogether, the result looks simple: a short, no-nonsense email that comes out roughly every other week that tells our owners what the basic numbers are and what we think needs to be done about them. But there’s a huge amount of time, effort, and most importantly constant, active analysis that goes into those simple-looking emails! And that kind of engagement — not just in the Marketing Department, but across our whole company — is one reason that we’re proud of the way we do business.